
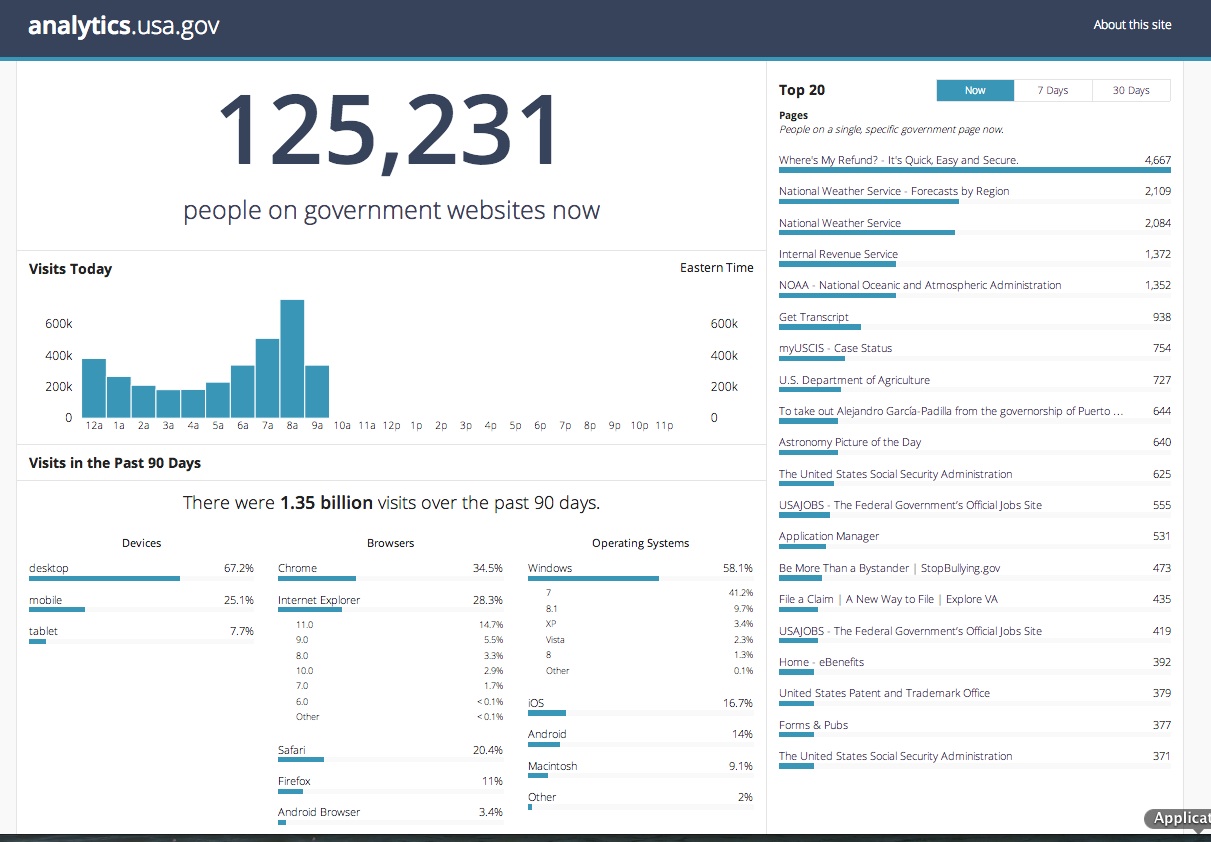
There are roughly 1,361 .gov domains* operated by the executive branch of the United States federal government, 700-800 of which are live and in active use. Today, for the first time, the public can see how many people are visiting 300 executive branch government domains in real-time, including every cabinet department, by visiting analytics.usa.gov.
According to a post on the White House blog, the United States Digital Service “will use the data from the Digital Analytics Program to focus our digital service teams on the services that matter most to the American people, and analyze how much progress we are making. The Dashboard will help government agencies understand how people find, access, and use government services online to better serve the public – all while protecting privacy. The program does not track individuals. It anonymizes the IP addresses of all visitors and then uses the resulting information in the aggregate.”
On Thursday morning, March 19th, tax-related services, weather, and immigration status are all popular. Notably, there’s an e-petition on the White House WeThePeople platform listed as well, adding data-driven transparency to what’s popular there right now.
Former United States deputy chief technology officer Nick Sinai is excited about seeing the Web analytics data opened up online. Writing for the Harvard Shorenstein Center, where he is currently a fellow, Sinai adds some context for the new feature:
“Making government web performance open follows the digital services playbook from the new U.S. Digital Services,” he wrote. “Using data to drive decisions and defaulting to open are important strategies for building simple and useful citizen-facing digital services. Teal-time and historical government web performance is another example of how open government data holds the promise of improving government accountability and rebuilding trust in government.”
Here’s what the U.S. digital services team says they’ve already learned from analyzing this data:
Here’s what we’ve already learned from the data:
- Our services must work well on all devices. Over the past 90 days, 33% all traffic to our sites came from people using phones and tablets. Over the same period last year, the number was 24%. Most of this growth came from an increase in mobile traffic. Every year, building digital services that work well on small screens becomes more important.
- Seasonal services and unexpected events can cause surges in traffic. As you might expect, tax season is a busy time for the IRS. This is reflected in visits to pages on IRS.gov, which have more than tripled in the past 90 days compared with the previous quarter. Other jumps in traffic are less easy to predict. For example, a recently-announced settlement between AT&T and the Federal Trade Commissiongenerated a large increase in visits to the FTC’s website. Shortly after the settlement was announced, FTC.gov had four times more visitors than the same period in the previous year. These fluctuations underscore the importance of flexibility in the way we deploy our services so that we can scale our web hosting to support surges in traffic as well as save money when our sites are less busy.
- Most people access our sites using newer web browsers. How do we improve digital services for everyone when not all web browsers work the same way? The data tells us that the percentage of people accessing our sites using outdated browsers is declining steadily. As users adopt newer web browsers, we can build services that use modern features and spend less time and money building services that work on outdated browsers. This change will also allow us to take advantage of features found in modern browsers that make it easier to build services that work well for Americans with disabilities, who access digital services using specialized devices such as screen readers.
If you have ideas, feedback or questions, the team behind the dashboard is working in the open on Github.
Over the coming months, we will encourage more sites to join the Digital Analytics Program, and we’ll include more information and insights about traffic to government sites with the same open source development process we used to create the Dashboard. If you have ideas for the project, or want to help improve it, let us know by contributing to the project on GitHub or emailing digitalgov@gsa.gov.
That last bit is notable; as its true all of the projects that 18F works on, this analytics dashboard is open source software.
There are some interesting additional details in 18F’s blog post on how the analytics dashbard was built, including the estimate that it took place “over the course of 2-3 weeks” with usability testing at a “local civic hacking meetup.”
First, that big number is made from HTML and D3, a Javascript library, that downloads and render the data. Using open standards means it renders well across browsers and mobile devices.
Second, 18F made an open source tool to manage the data reporting process called “analytics-reporter” that downloads Google Analytics reports and transforms that data into JSON.
Hopefully, in the years ahead, the American people will see more than the traffic to .gov websites: they’ll see concrete performance metrics like those displayed for the digital services the United Kingdom’s Government Digital Services team publishes at gov.uk/performance, including uptime, completion rate and satisfaction rate.
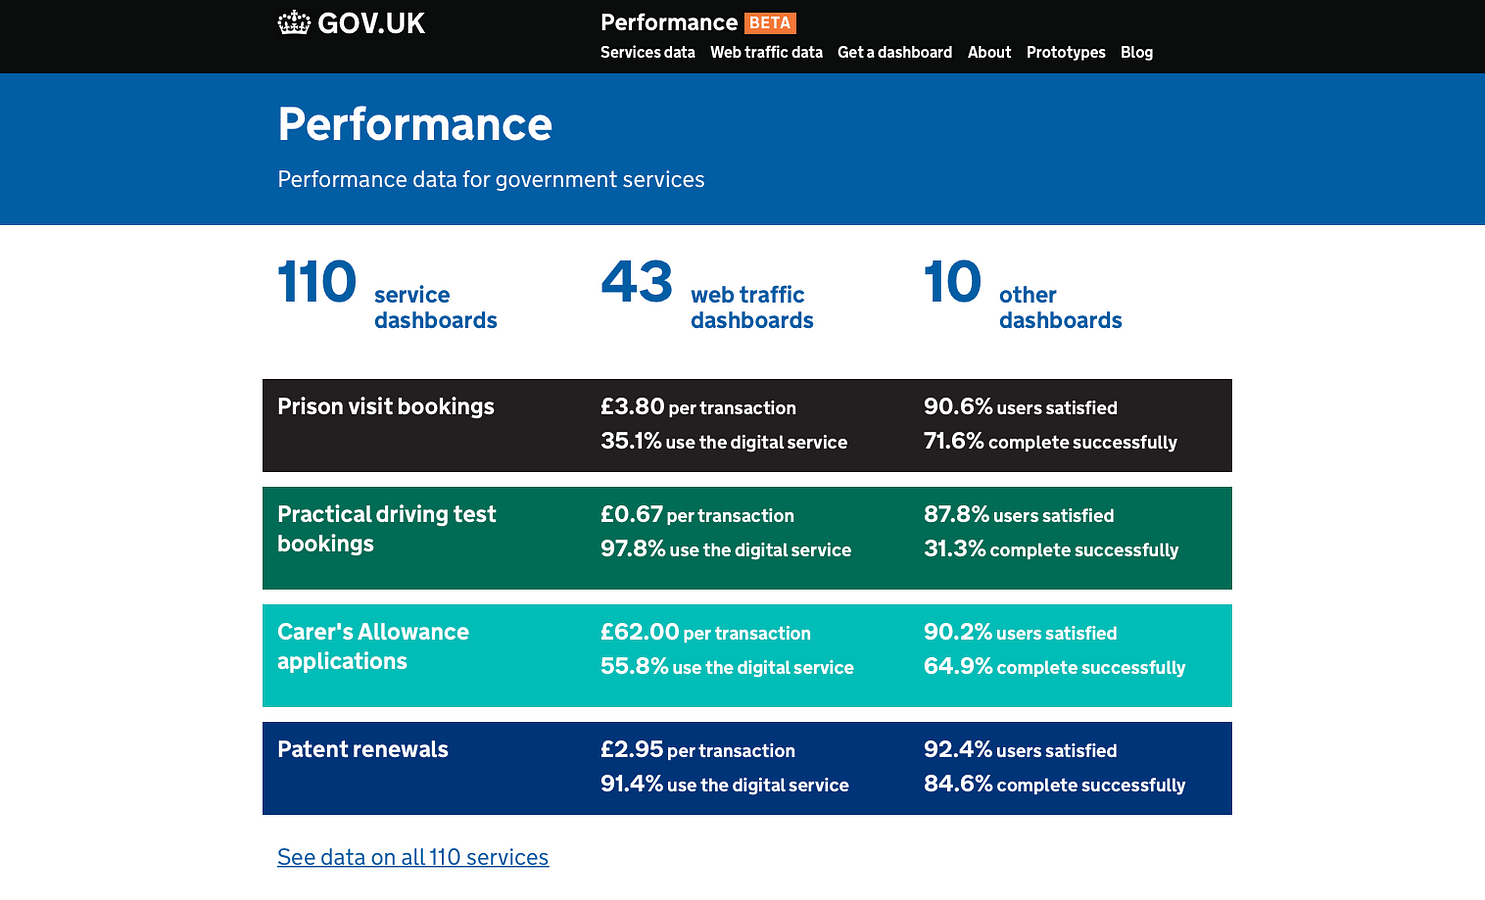
In the future, if the public can see the performance of Heathcare.gov, including glitches, or other government digital services, perhaps the people building and operating them will have more accountability for uptime and quality of service.

Pingback: The Tech Loop: Big Data and March Madness • GovLoop
Pingback: Meet stealth-mode Doofl. It's scaling the Ice Bucket Challenge [Startup Roundup] - Technical.ly DC
Pingback: Gilbane Advisor 3.31.15 | Gilbane.com